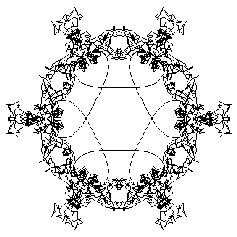
Every journey begins with a single step. It is made up of many steps. Just so, any drawing is only a collection of straight line segments. To detail each segment we need
 It's obvious (at least to any mathematician)
that after 2010 segments we're back to where we started.
What we get is the cover picture
.
It is fortuitous that 2010, with cubes in the numerator,
happens to create an attractive logo.
I have known this for quite some years
and have been using it on my preprints.
(Also it appears on the dust jacket of my book
``Notes on Fermat's Last Theorem''
 ,
recently published by
Wiley-Interscience).
It's fortunate that the logo is a propos in respect of the
Strategic Review.
 Actually, 2010 is not really all that interesting, mathematically.
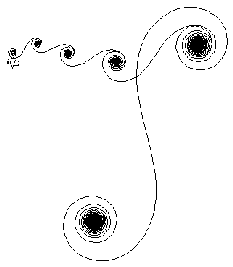
Instead the ``Loch Ness Monster'',
constructed sequentially by adjoining segments at angles
![]() ,
, ![]() ,
, ![]() ,
, ![]() ,
, ![]() ,
,
![]() and so on, is much more interesting.
Some 5,000 segments appear in the picture shown here.
But it's not just laziness that made me stop after, say, 5000 segments.
Eventually the black-hole comprising the monster's tail
grows ever larger, swallowing-up the entire picture.
It is an instructive exercise to work out,
without resorting to the printer,
just how many complete curls comprise the monster.
For this one must compute the locations of those `stationary' points,
and also find those points near which the curve moves most rapidly.
and so on, is much more interesting.
Some 5,000 segments appear in the picture shown here.
But it's not just laziness that made me stop after, say, 5000 segments.
Eventually the black-hole comprising the monster's tail
grows ever larger, swallowing-up the entire picture.
It is an instructive exercise to work out,
without resorting to the printer,
just how many complete curls comprise the monster.
For this one must compute the locations of those `stationary' points,
and also find those points near which the curve moves most rapidly.