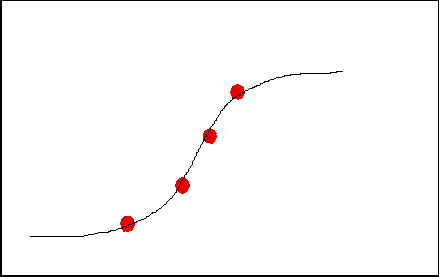
 If you look carefully at the original graph we plotted, you can see that it was not only possible to draw a straight line through the points. Perhaps a more sensible curve would be like the one shown at right.
The answer to this question is almost certainly NO.
Surely there is no fundamental physical reason why a person's height should vary linearly with the year.
Common sense says that we would expect a man's height ot stay more or less the same over the centuries. The increases after the second World War may be due to factors such as a better diet, generally higher living standards and the availability of better medical care.
 If you look carefully at the original graph we plotted, you can see that it was not only possible to draw a straight line through the points. Perhaps a more sensible curve would be like the one shown at right.
As you might expect, it is not nearly as simple to work with non-linear relationships like this, but the tools do exist and with the advent of computer packages to handle such problems, they really present not much more practical difficulty than simple straight lines.
Our problem when working with this example is that we don't really have enough data points to work with. We were only given four points in the original newspaper article. It is safe to assume that the researchers who worked on this problem had much more data at their disposal and were able to determine a meaningful relationship between the heights and the years. Presumably, they were also aware of the dangers of extrapolating too far.
In conclusion, although we found a model that fitted the data we were given and arrived at the "correct" conclusion, hopefully the above interpretation of our results have convinced you that our model was fatally flawed. You should also realise why the problems arose and will hopefully avoid these traps in your own graphing problems.
 Table of Contents