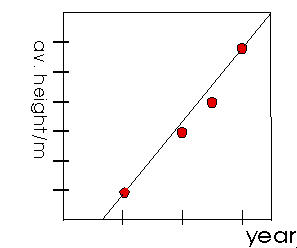
 There seems to be a LINEAR RELATIONSHIP between the variables "year" and "av. height".
 There seems to be a LINEAR RELATIONSHIP between the variables "year" and "av. height".
A LINE OF BEST FIT can now be constructed. This is the straight line that the deviates the least from the data points. There is a precise mathematical definition of the phrase "deviates least" and algorithms exist for fitting such a line. However, in many cases a good line can be drawn by eye and that is what we have done here.
Now that we have this line, we can write down an EQUATION for it. The generic equation for a straight line has the form
Here, m and b are constants, y is the dependent variable, while x is the independent variable.
In terms of our variables then, this equation becomes
In order to make use of this equation, we need to determine the values of the constants m and b.
 How to determine the constants.
 Table of Contents