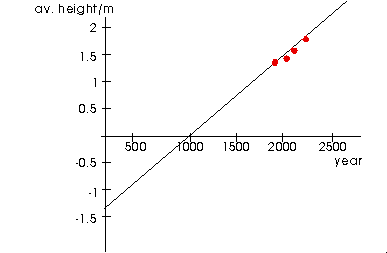
 Now for the other constant, b. This corresponds to the y-intercept of the line, or the y-value ("av. height" value) when x ("year") is zero.
The constant m can be thought of as the "slope", "rate of change", or gradient of the line. We need to select two data points on the graph for which we know the "year" and "av. height" values in order to compute the gradient.
Since it doesn't matter which two points we choose, we will just choose two points at random, say when the "av. height" is 1.75m and 1.90m.
Reading off from the graph, we find that at these two height values, the corresponding years are 1945 and 2040, respectively. Note that we are finding points on our "line of best fit", which may be slightly different from the actual data points.
We compute the gradient as
Note the number of significant figures in our answer.
 Now for the other constant, b. This corresponds to the y-intercept of the line, or the y-value ("av. height" value) when x ("year") is zero.
To determine this, we have to extend our graph a little further than it currently is - all the way back to year zero! This gives us the graph on the left. We could now read off the value of b directly from the graph, if our scale permitted it.
Alternatively, we can calculate the value of this constant by rearranging the equation of the straight line as
We simply choose an appropriate value for x (year) and y (av. height) and we already know what m is. Doing the arithmetic gives (for example)
Putting all of this together gives us a good LINEAR RELATIONSHIP between the average height and the year:
Of course, we must always remember that the height is to be measured in metres.
 What about the Professor's conclusion?
 Table of Contents